Your Backyard Is a Lab: Real Science You Can Do During Every ISS Pass
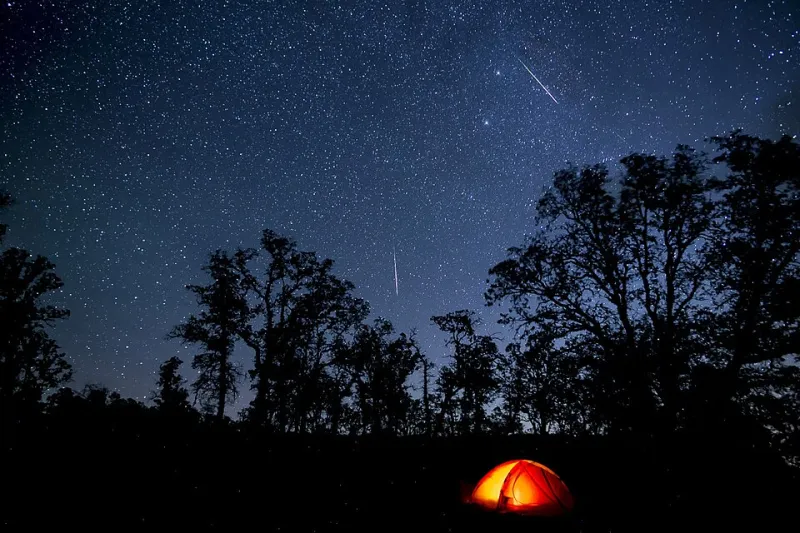
Photo: blmcalifornia, Public domain, via Wikimedia Commons
Most people treat an ISS pass the same way they'd treat a shooting star — a quick wow moment before heading back inside. And honestly? That's fine. There's nothing wrong with just enjoying the show.
But here's something worth knowing: that bright dot cruising across your sky at 17,500 miles per hour is one of the most predictable, well-documented objects in low Earth orbit. Its position is known to within meters. Its brightness has been modeled by researchers for decades. Its exact timing can be calculated with extraordinary precision. That combination — predictability plus visibility plus accessibility — makes it a genuinely useful tool for anyone curious enough to take the next step from observer to experimenter.
You don't need a research grant. You don't need a rooftop observatory. A smartphone, a notebook, and a clear night are enough to get started.
Why the ISS Makes Such a Good Scientific Target
Most natural sky objects are either too faint, too unpredictable, or too distant to serve as reliable experimental baselines for amateur work. The ISS is none of those things. It's magnitude -3 to -4 at peak brightness — outshining everything in the sky except the Moon and Venus. It follows a path that tracking tools like Heavens-Above or NASA's Spot the Station can predict to within seconds. And it passes over most US locations multiple times per week.
That predictability is the whole ballgame. When you know exactly where something should be and exactly how bright it should appear, any deviation from those predictions becomes scientifically interesting. You're no longer just watching — you're measuring.
Experiment 1: Testing Atmospheric Refraction Along the Horizon
Here's a simple one that requires nothing more than a clear view toward the horizon and a way to log timestamps.
Atmospheric refraction bends light from objects near the horizon, making them appear slightly higher in the sky than they actually are. This effect is well-documented but varies with temperature, humidity, and local air pressure. Prediction models account for average refraction, but real-world conditions create measurable deviations.
During a pass that rises from low on the horizon, record the exact moment the ISS first becomes visible to you, then compare that to the predicted rise time from your tracking app. A station that appears slightly earlier than predicted — or at a marginally different compass bearing — is giving you a real-time snapshot of how your local atmosphere is bending light that evening.
Log these observations across multiple passes over several weeks, noting temperature and humidity each time. Patterns will emerge. You'll start building a localized refraction dataset that actually reflects your sky, not the averaged model.
Experiment 2: Brightness Prediction Accuracy
Tracking apps estimate ISS magnitude using a model based on the station's geometry relative to the Sun and your position. These predictions are pretty good — but not perfect. The station's orientation changes, solar panels adjust, and atmospheric transparency shifts night to night.
Your job: rate the ISS brightness at maximum elevation during each pass using a comparison method. Pick a familiar star near the pass path — Arcturus, Vega, Jupiter, whatever's convenient — and judge whether the ISS appears brighter, dimmer, or roughly equal at its peak. Assign a rough magnitude estimate and compare it to what your tracking tool predicted.
Over time, you'll start identifying systematic biases. Does your local sky consistently show the ISS dimmer than predicted? That might reflect your area's light pollution or typical haze levels. Do summer passes skew brighter or dimmer than winter ones? You're building observational data that, if logged carefully, has genuine value.
Several citizen science platforms, including those affiliated with the American Meteor Society and independent satellite observation networks, actively collect this kind of brightness data. Your logs don't have to stay in a notebook.
Experiment 3: Timing Occultations with Basic Equipment
This one takes a bit more patience but delivers the most satisfying results.
An occultation happens when the ISS passes directly in front of a star, briefly blocking its light. These events are rare from any single location, but they do occur — and when they do, the duration of the blackout (often just a fraction of a second) can be used to calculate the apparent angular size of the station as seen from your position, which cross-references against known orbital data.
Predicting occultations requires more specialized tools than a basic tracking app. Software like Calsky (now partially archived) or community databases on satellite observation forums publish predicted occultation tracks. If one is forecast for your area, even a video recording on a smartphone pointed through binoculars can capture the event. Frame-by-frame analysis of the video gives you timing data accurate to within a few hundredths of a second.
This kind of timing data has historically been used to refine orbital element sets — the mathematical descriptions of a satellite's path. Observations from the ground help correct for drag, solar pressure, and other forces that nudge orbits over time.
Experiment 4: Measuring Your Own Reaction Time (Seriously)
This sounds trivial, but it's actually a meaningful calibration exercise.
When you're timing any sky event manually — marking when the ISS crosses a reference star, for instance — your personal reaction time introduces a systematic error. Studies suggest the average human reaction time for visual events is roughly 0.2 seconds, but it varies by individual and conditions.
You can measure your own baseline by using reaction time apps (there are free ones everywhere) under similar nighttime conditions and log the average. Then subtract that value from your manually recorded times to get a corrected observation. It's a small thing, but it's the difference between raw data and calibrated data — and it's exactly the kind of methodological care that separates useful citizen science from just writing down numbers.
Connecting Your Work to the Bigger Picture
Here's the part that tends to surprise people: amateur satellite observers have a documented history of contributing genuinely useful data to the scientific community. The community around visual satellite tracking — particularly through organizations like Satobs.org and the Heavens-Above forums — has been doing this for decades, long before smartphone apps made the ISS a household spectacle.
Your observations won't rewrite physics textbooks. But a carefully kept log of brightness estimates, timing deviations, and atmospheric notes — recorded consistently over months from a fixed location — becomes a real dataset. Share it. Post it to citizen science platforms. Connect with local astronomy clubs across the US; many have formal programs for coordinated satellite observations.
The ISS passes over your head whether you're watching or not. The difference between a casual glance and a logged observation is about three minutes and a notebook. That's a pretty low barrier to doing something that actually counts.
Getting Started Tonight
If you want to run your first experiment on the next clear pass, here's the minimal setup:
- Tracking app: NASA's Spot the Station or Heavens-Above for pass predictions
- Timing: Your phone's stopwatch, started at a reference star crossing
- Brightness comparison: Identify one or two stars near the predicted path in advance
- Log: A simple notes app or paper notebook with date, time, temperature, and your observations
That's it. No telescope required. No astronomy background needed. Just a willingness to pay attention and write things down.
The sky isn't just something to look at. On the nights the ISS swings overhead, it's something to measure.